This article also appeared in the January-February 2025 issue of Fertilizer International.
Authors:
- Fabiano Silvestrin, Principal Advisor, Global Market Development Agriculture
- Eduardo Saldanha, Agriculture Development Specialist, Latin America
Boron accumulation curve in soybean
Scientific research over the years has studied the patterns of absorption, partitioning, and remobilization of nutrients in soybean cultivation. In recent years, studies have shown that the potential for nutrient accumulation—including boron—has increased significantly due to current high productivity levels. Research in Brazil (Table 1) shows that the most current soybean varieties (SYN 1039 and DM 6563) presented higher values of boron accumulation when compared to the conventional variety (BRS 184). This data reinforces the need to know the nutritional requirements of different soybean varieties planted in different regions, with a view, above all, towards better nutrition management.
Table 1. Boron extraction and export in soybean varieties in Brazil
| Variety |
Productivity |
Total uptake |
Removal with seed |
Harvest index (HI)4 |
| |
kg/ha |
g/ha |
% |
| BRS 1841 |
3230 |
183 |
80 |
43 |
| SYN 10592 |
4000 |
375 |
125 |
33 |
| DM 65633 |
3000 |
225 |
73 |
32 |
1Conventional; 2RR; 3RR2 Pro; 4HI values are a relative indicator of nutrient partitioning to soybean grain tissues, quantified as the ratio of grain nutrient removal to total nutrient accumulation.
Source: Modified from Oliveira Júnior et al. 2016
A study conducted in the United States shows data on boron accumulation in soybeans (Table 2). The values of total absorption and removal by soybean seeds are relatively close to those observed in Brazil (Table 1). Variations in accumulation values are normal and reflect differences between production environments, climate conditions, and soil and cultivation techniques. An important data point from this study is the maximum boron accumulation rate. A value of 5.18 grams per hectare per day was verified as the maximum demand for boron by soybeans in the R4 (reproductive) period where peak accumulation was observed. This result demonstrates the importance of using fertilizer sources—such as Granubor®—that offer gradual and total boron release, guaranteeing a consistent supply in phases of greater demand.
Table 2. Total accumulation, soybean seed removal, harvest index, and maximum boron accumulation rate: Average productivity of 3840 kg/ha of seeds.1
| Nutrient |
Total uptake |
Removal with soybean seed |
Harvest index (HI) |
Max. accumulation rate |
| |
g/ha |
% |
g/ha/day |
Growth stage |
| Boron |
325 |
111 |
34 |
5.18 |
R4 |
1Estimated using mean values measured at R8 (physiological maturity)
Source: Modified from Bender et al. 2015
The study carried out by EMBRAPA (Brazilian Agricultural Research Corporation) presents the boron accumulation curve for three soybean varieties (Figure 1). Soybean cultivation presents a demand for boron starting in the vegetative phases and advancing into the reproductive period—reaching the maximum accumulation between periods R4 and R5. These results confirm that there is a strong increase in the boron accumulation rate between the reproductive periods R2 and R5.
Figure 1. Boron accumulation curve in soybean varieties in Brazil
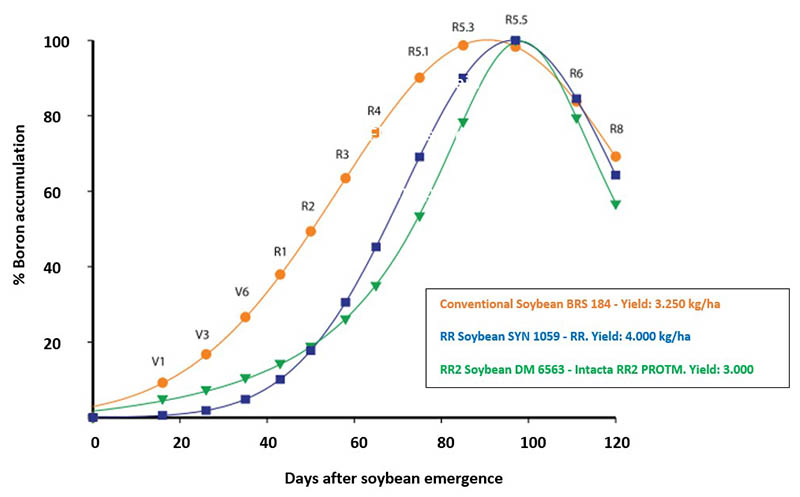
Source: Modified from Oliveira Junior et al. 2016
Granubor: A fertilizer with high agronomic efficiency
To evaluate boron release (percolation) from different fertilizer sources, U.S. Borax carried out an experiment under controlled laboratory conditions using columns filled with soil. A dose of boron from different fertilizer sources was applied, with daily applications of water. The volume of drained water (percolated) was collected daily and the analysis of the soluble content of boron in this solution was carried out. The boron sources tested were boric acid (17.5% B), Granubor (15% B), and five types of ulexites from different regions.
Figure 2. Columns filled with soil for testing the release of B in fertilizers
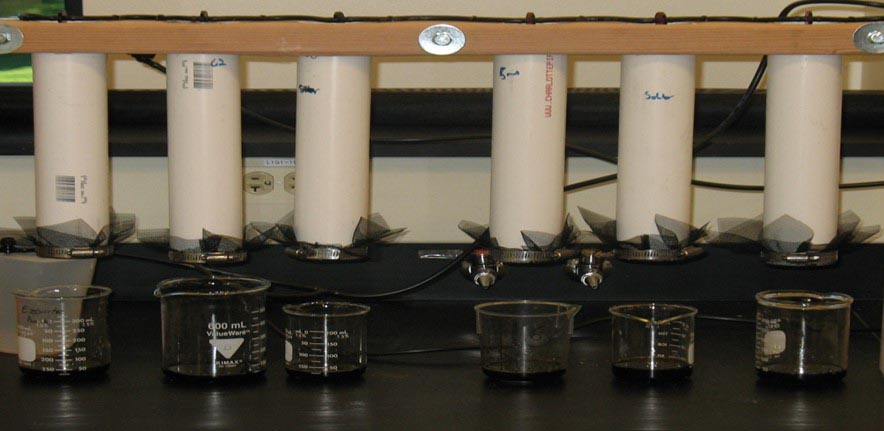
Source: U.S. Borax internal studies
Experimental procedure in soil percolation
- 300 g of topsoil (clayey soil)
- ~ 10 inches deep (classified as well drained) placed in 12’’ x 2” PVC pipes
- Soil content < 0.1 ppm of B
- 250 g of soil placed in a tube followed by 1 g of boron equivalent fertilizer, covered by 50 g of soil
- Watered 100 ml/day
- Boron percolated analyzed by ICP
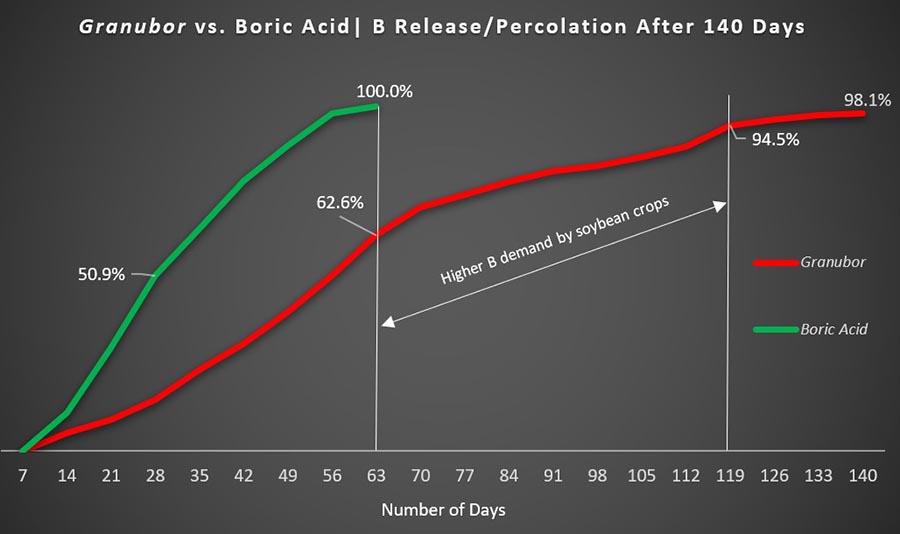
Based on the lab trial results (Figure 3), 100% of boron present in the boric acid percolated after 63 days (9 weeks), and 98.1% of boron from Granubor percolated after 140 days (20 weeks). These results indicate that boric acid presented a fast percolation speed due to the rapid solubilization. From a practical perspective in field applications, boric acid may not fully meet boron demands throughout the soybean growth cycle.
There was a strong concurrence between the release of boron from Granubor and the greatest boron demand by the soybean plants (Figures 3 and 4). When applied at the correct time, Granubor makes boron available when it’s most needed by the soybean crops.
Figure 3. Boron release curve in boric acid and Granubor
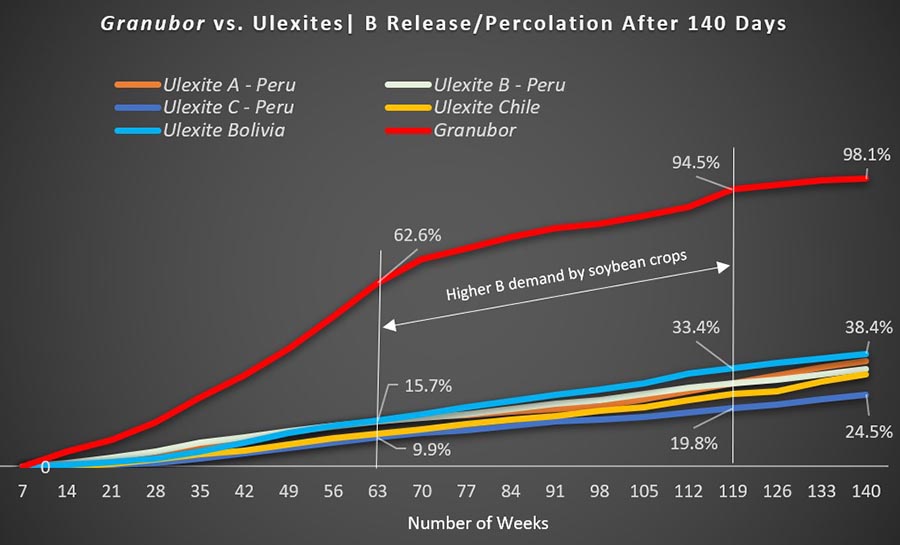
Based on the lab trial results (Figure 4), sources of ulexite will release between 24.5 and 38.4% of boron after 140 days, and as illustrated above 98.1% of boron from Granubor will be percolated after 140 days (20 weeks). These results indicate the limitations of different ulexite sources of boron found in the market. Ulexite products have partial boron solubility, meaning that at the end of the study’s 140 days, there was a release of 31.4% (on average) of boron. This data suggests that soybeans fertilized with ulexites in the field will tend to present nutritional boron deficiency. The crop’s boron demand, in total values and during high nutritional need of the flowering period (R1 to R5), will not be sufficient. Again, Granubor had a superior performance regarding the gradual and total release of boron. Research proves that Granubor will be able to fully meet boron demands for soybean cultivation, in synchronicity with peak demand.
Figure 4. Boron release curve in five ulexites and Granubor
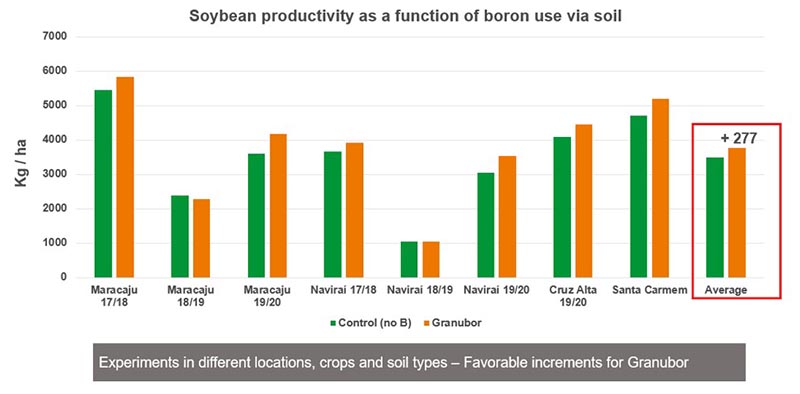
Research studies carried out with different agronomic research institutions in Brazil show average increments of 277 kg/ha in soybean cultivation using Granubor as a source of boron (Figure 5). Data was obtained using ANOVA tests, mean tests, and reliable experimental designs—giving us confidence in the results and recommendations of Granubor.
In short, field data and research studies have shown that Granubor provides the best solution for soybean growers who need a boron fertilizer for soil application.
Soybean is a global crop, and different regions require different nutrient amendments. On those farms where growers are using Granubor, we see a significant amelioration in boron deficiency symptoms. Field data and research studies have shown that Granubor provides the best solution for soybean growers who need a boron fertilizer for their soil application (Figure 5).
Figure 5. Compilation of results from research studies evaluating soybean response to the use of Granubor
References
Resources